
TL;DR: Product market fit means a clearly defined group of customers wants your product badly enough to keep using it, pay for it and tell other people about it without you pushing. Marc Andreessen named it in 2007, and CB Insights found poor product-market fit in 43% of 385 startup shutdowns it studied in 2026. The proof comes from four places at once: the Sean Ellis test (40% or more "very disappointed"), retention cohorts that flatten, referral and organic share, and customers who pay without a long chase. A survey alone lies, and so does a signup chart. Put your own numbers into the PMF evidence scorecard below and see which signal agrees and which one disagrees.
Product market fit (also written product-market fit and shortened to PMF) is the point where a specific group of customers wants what you sell so much that they keep using it, pay for it and bring others in on their own. In plain words: you have found people with a real problem, and your product fixes it well enough that losing it would hurt them. Marc Andreessen gave the idea its name in his essay "The only thing that matters", posted on 25 June 2007, where he described product market fit as "being in a good market with a product that can satisfy that market."
I have built startups in Europe for a long time, and my blunt verdict is this: founders lie to themselves about PMF more than about any other number. A press mention, a waitlist and three friendly pilots feel like traction and prove almost nothing. This guide covers how to measure product market fit, Superhuman's published PMF engine, the false signals, what to do before PMF and when to raise. Every number was checked against its source on 7 November 2026.
What is product market fit, in plain words?
Andreessen's essay makes one claim that still annoys product people: market matters most. In a great market, he wrote, the market pulls product out of the startup, and in a terrible one the best product and team lose anyway. He also quoted investor Andy Rachleff: the number one company-killer is lack of market.
The terms I use in this guide:
- Product market fit (PMF): a defined segment of customers buys, keeps using and recommends your product with little pushing from you.
- Ideal customer profile (ICP): a precise description of the customer who gets the most from your product, such as "agency owners with 5 to 20 staff who bill by the hour", never "SMBs".
- Retention cohort: a group of customers who started in the same week or month, tracked over time to see what share is still active.
- Churn: the share of customers (or revenue) you lose in a period.
- Sean Ellis test: a one-question product market fit survey that asks users how they would feel if they could no longer use your product.
- Net revenue retention (NRR): what a group of customers pays you now, compared with what the same group paid a year ago, after upgrades, downgrades and cancellations.
- Organic growth: new customers who arrive through word of mouth, referrals and search, with no paid ads behind them.
My own definition is stricter than most textbooks: you have PMF when customers pull the product out of your hands faster than you can improve it, and you can name exactly who those customers are. If you cannot name the segment, you have lucky sales.
How does the PMF evidence scorecard work?
The scorecard combines five signals into one verdict: your survey answers, the share of a signup cohort still active at week 8 or month 6, the share of new customers from referral or organic channels, trial-to-paid conversion, and net revenue retention if you sell subscriptions. Pick your business model, because a B2C app and a B2B SaaS tool keep users at very different rates.
Each signal gets a verdict (strong, weak or missing) with its threshold and source, and where no published benchmark exists the tool says "our rule of thumb" out loud. The most useful line is "which signal disagrees": when your survey says yes and your retention says no, the scorecard tells you to believe retention.
Why does product market fit decide whether a startup survives?
CB Insights studied 431 VC-backed startups that shut down publicly since 2023 and found the failure reasons for 385 of them, in a report published on 5 March 2026. The numbers:
- 70% ran out of capital, which the report calls almost always the final cause of death and rarely the root problem.
- 43% suffered from poor product-market fit.
- 29% blamed bad timing and 19% unsustainable unit economics.
- Two-thirds of the PMF failures were early-stage companies that never found a market at all.
Read the top two numbers together: money runs out because the product never found a market that pays. In my experience, a cash crunch is a segment problem in disguise, which is why I push founders to validate cheaply before building much. Our guide on how to validate a startup idea with less than €1,000 shows the first tests, and Business Model Analysis for Startups helps you check whether the money side can work once demand is real.
What are the signs of product market fit?
Andreessen described both states plainly. Without fit, customers do not quite get value and word of mouth does not spread. With fit, customers buy as fast as you can deliver and money piles up in the bank. The signs of product market fit I watch for, in order of how hard they are to fake:
- Customers come back without reminders. Your retention curve drops in the first weeks and then FLATTENS.
- Customers complain when something breaks. Angry tickets about an outage mean people depend on you.
- New customers name a friend or colleague as the reason they came. Ask every signup "how did you hear about us?"
- Sales calls get shorter. Prospects arrive convinced and ask about price and start date.
- People pay before the product is finished. Pre-orders and deposits count, compliments do not.
- Requests pile up from the same type of customer. Requests from ten different types mean the opposite.
In B2B, add one more: customers expand on their own, adding seats or upgrading without a sales push.
How do you measure product market fit with numbers?
Five measures matter, and each one lies in its own way. The table compares them.
Where did the Sean Ellis 40% test come from?
Sean Ellis ran early growth at Dropbox, LogMeIn and Eventbrite. According to Rahul Vohra's account in First Round Review, Ellis benchmarked nearly a hundred startups with his customer development survey and found the line at 40%: companies that struggled to grow almost always had fewer than 40% of users answer "very disappointed". The question is simple: "How would you feel if you could no longer use [product]?" with three answers, very disappointed, somewhat disappointed and not disappointed.
Two rules from Vohra make the test usable: survey only people who used the product at least twice in the last two weeks, and expect directionally correct results at about 40 respondents. A public reference point: Hiten Shah asked Ellis' question to 731 Slack users in 2015, and 51% said they would be very disappointed without Slack.
Why do retention cohorts that flatten matter most?
A retention curve plots the share of a cohort still active week after week. Every curve drops at the start, because some people only came to look. What counts is whether it slides toward zero or levels off: a flat tail means a group of people found lasting use. Lenny Rachitsky's benchmark study with Casey Winters sets "good" and "great" six-month retention by category.
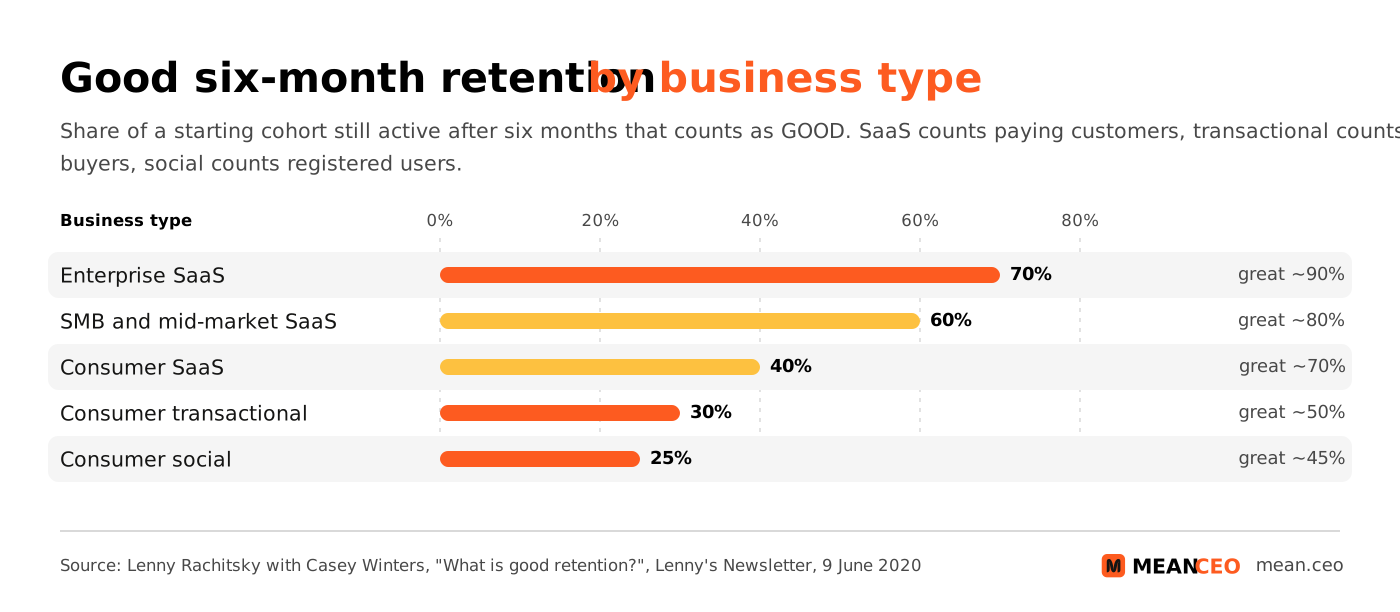
Mind the denominators: consumer SaaS counts paying subscribers, B2B SaaS counts paying companies, consumer transactional counts users with one transaction or more. I trust a flat retention curve over any survey, because retention is what people DO and a survey is what they SAY. For the mechanics of tracking cohorts, read our guide to retention metrics and what to track.
What does net revenue retention tell a B2B founder?
Net revenue retention divides a cohort's monthly revenue today by what the same cohort paid twelve months ago. Above 100%, expansions beat cancellations and you grow with zero new customers. Lenny Rachitsky's study puts "good" at about 100% for bottom-up SaaS, 90% for land-and-expand SMB and mid-market SaaS and 110% for enterprise SaaS, while consumer subscriptions sit at about 55%. If your NRR is low, our guide on expansion revenue through upsells and cross-sells shows where the extra revenue comes from, and the playbook on win-back campaigns for churned customers covers the other side.
Why do referral share and sales cycle pull count?
Andreessen's picture of a market without fit includes word of mouth that does not spread, so count it: ask every new customer where they heard about you. I use 30% of new customers from referral or organic channels as my own rule of thumb for a strong signal. No published benchmark backs that number, and the scorecard says so.
Sales cycle pull is the B2B version: track median days from first call to signed contract each month. When it drops while your price holds, the market is pulling. Our guide to bootstrapped growth metrics that matter shows how to keep these numbers in one simple sheet.
What did Superhuman's PMF engine show?
Rahul Vohra, founder and CEO of the email app Superhuman, published the most detailed public account of measuring PMF in First Round Review on 12 November 2018. His team had been coding since 2015 and had 14 people by summer 2017. Then they ran the Sean Ellis test.
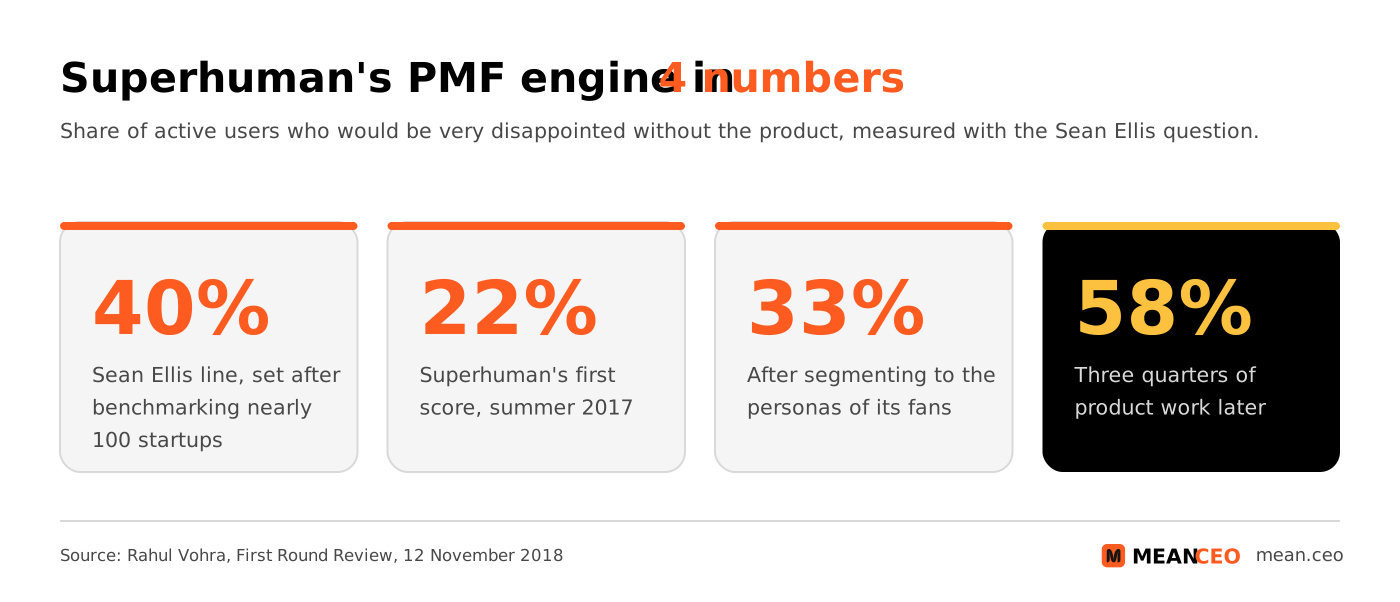
- 22% of surveyed users said "very disappointed". Well below 40%, so no PMF yet.
- After segmenting to the personas of the very disappointed group (founders, managers, executives and business development people), the score rose to 33%.
- Within three quarters of product work, the score nearly doubled to 58%.
The method has four parts. They asked four questions (disappointment, who benefits most, main benefit, how to improve). They narrowed the target to the personas who loved it. They ignored the "not disappointed" group and listened only to "somewhat disappointed" users whose main benefit matched what fans loved (speed), and that group pointed at the missing mobile app. Then they split the product plan 50/50: half on what fans loved (speed, keyboard shortcuts, automation, design details), half on what held back the almost-fans (mobile, calendar, attachments, search, connections to other tools). The score was tracked weekly, monthly and quarterly.
My take: segmentation is the whole lesson. Superhuman gained 11 points before writing new code, just by deciding who the product was for. The common reflex when the score disappoints is to widen the target, which is the exact opposite of what worked here.
Which signals lie about product market fit?
The most dangerous PMF signals feel great on social media. How I sort them:
The big-logo pilot deserves its own warning. The trap is spending months on a famous corporate name, rebuilding the product around one manager's wishes and ending up with a reference slide and no revenue. A pilot proves fit only when it converts to a paid contract and the next similar company signs faster.
Confirmation bias makes it worse, and our list of tools and tips to prevent confirmation bias when validating ideas covers the habits that help.
What should you do before you reach product market fit?
Narrow the segment, then narrow it again. Before PMF, the job is to find the smallest group of people who love the product and make it so good for them that they recruit the next group. Trying to serve everyone at once is the fastest way to stay pre-PMF. The loop I run, adapted from Superhuman's engine:
- Pick the survey group. Take users active at least twice in the last two weeks. Aim for 40 or more answers.
- Send the four-question survey (copy it from the box below) and calculate the share of "very disappointed".
- Write a persona for every respondent: role, company size, what they used before.
- Find the segment with the highest "very disappointed" share and write it down as your ideal customer profile. Our guide to niche markets in Europe helps you describe a segment precisely.
- Interview five fans and five almost-fans with the four-question script below.
- Split next quarter's product work 50/50: half on what fans love, half on what blocks the almost-fans who share the fans' main benefit.
- Point your marketing at the new segment only, starting with the homepage headline.
- Re-run the survey and the retention cohort every quarter and put both into the scorecard.
Copy this PMF survey (send to users active at least twice in the last two weeks):
- 1. How would you feel if you could no longer use [product]? (Very disappointed / Somewhat disappointed / Not disappointed)
- 2. What type of people do you think would benefit most from [product]?
- 3. What is the main benefit you get from [product]?
- 4. How can we improve [product] for you?
Copy this 4-question interview script (20 minutes, one customer at a time):
- 1. Walk me through the last time you used [product]. What were you trying to get done?
- 2. What did you use for this before you found us, and why did you switch?
- 3. If [product] disappeared tomorrow, what would you do instead, and what would it cost you?
- 4. Who else do you know with the same problem? Can I mention your name when I contact them?
The fourth interview question is my favourite PMF test of all. A fan gives you names on the spot. A polite user goes quiet.
If no segment loves the product after two or three rounds, change direction. Our guide on how to pivot without burning your bootstrap runway covers that call, the services-to-product pivot shows how to earn while you search, and customer feedback systems and NPS explains how to collect answers systematically.
What do product market fit examples look like in Europe?
The clearest recent European case is Lovable, the Swedish AI app builder. According to Tech.eu's report of 23 July 2025, the company announced that it passed $100 million in annual recurring revenue eight months after launch, with more than 2.3 million active users. These figures are company-reported and unaudited, so treat them as the founders' claim.
What makes Lovable a PMF story is the pull. Revenue at that speed happens only when users pay and tell others faster than any sales team could reach them, which is Andreessen's market pulling product out of a startup. The lesson is about timing more than AI: Lovable rode a demand that already existed.
Slack (51% in Hiten Shah's 2015 survey) and Superhuman (22% to 58%) remain the best published survey cases. I found no European startup that published its own survey scores in that detail. Publish yours and I will gladly cite you.
When should you raise money: before or after product market fit?
My answer: raise for growth AFTER the scorecard turns strong, and before that, raise only what you need to find fit. Money before PMF should buy experiments, and money after PMF buys distribution. A big round before PMF gets spent on marketing a product nobody keeps, and CB Insights' 70% "ran out of capital" figure shows where that ends.
Before PMF, I prefer customer money and non-dilutive money: customer-funded growth before pre-seed shows how pre-sales fund the search, and the bootstrapping versus VC funding comparison helps you pick a side. When you pitch, put your retention curve on a slide, as our famous and European pitch deck examples show. If pricing is part of the problem, read pricing strategy for bootstrapped SaaS before you discount.
Find the segment before you spend a euro on growth. Map your customer, problem, channels and revenue on one page with the free mean.ceo lean canvas template, test a fresh angle with the business idea generator when your survey says no segment loves you, and run the non-dilutive funding finder to see which grants can pay for the search. Renaming for a narrower segment? The business name generator gives you options in a minute.
What should you do with your PMF evidence this month?
Product market fit is a pattern across several numbers pointing the same way, and a single score never proves it. The short version:
- Send the four-question product market fit survey to active users and get at least 40 answers.
- Build one retention cohort chart and check whether it flattens.
- Ask every new customer where they heard about you, and count referrals and organic search.
- Put all of it into the PMF evidence scorecard and read the "which signal disagrees" line first.
- If the signals disagree, narrow the segment before you build anything new.
The founders who reach PMF fastest look at the ugly number first. Start there this week.
FAQ: product market fit
What is product market fit in simple terms?
A specific group of customers wants your product enough to keep using it, pay for it and recommend it without you pushing. Marc Andreessen named the idea in 2007.
How do you measure product market fit?
Combine the Sean Ellis survey (40% or more "very disappointed"), a retention cohort that flattens, referral and organic share, trial-to-paid conversion and, for B2B subscriptions, net revenue retention. When they disagree, trust retention and payment over survey answers.
What is the Sean Ellis test?
A one-question product market fit survey: "How would you feel if you could no longer use [product]?" (very, somewhat or not disappointed). According to Rahul Vohra in First Round Review, Ellis benchmarked nearly a hundred startups, and those under 40% "very disappointed" almost always struggled to grow.
How many responses do you need for a product market fit survey?
About 40, according to Rahul Vohra. Survey only users active at least twice in the last two weeks.
What is a good retention rate for product market fit?
Lenny Rachitsky and Casey Winters put "good" six-month retention at about 25% for consumer social, 40% for consumer subscriptions, 60% for SMB and mid-market SaaS and 70% for enterprise SaaS. The curve also has to flatten.
Can you lose product market fit?
Yes. Markets move and competitors copy, so re-run the survey and the retention cohort every quarter and watch churn by segment.
Should you raise money before product market fit?
Raise only what you need to find fit, ideally from customers, grants or small angel cheques. Large rounds belong after the signals turn strong.
What are examples of product market fit?
Superhuman went from 22% to 58% on the Sean Ellis test in three quarters, Slack scored 51% among 731 surveyed users in 2015, and Sweden's Lovable announced $100 million in annual recurring revenue eight months after launch.
About the Author
Violetta Bonenkamp, also known as MeanCEO, is an experienced startup founder with an impressive educational background including an MBA and four other higher education degrees. She has over 20 years of work experience across multiple countries, including 5 years as a solopreneur and serial entrepreneur. Throughout her startup experience she has applied for multiple startup grants at the EU level, in the Netherlands and Malta, and her startups received quite a few of those. She’s been living, studying and working in many countries around the globe and her extensive multicultural experience has influenced her immensely.
